start with a dataset
Try an example or import your own file. Browse the rows, choose a view, and change it as your question takes shape: a calendar of temperatures, a map of subway delays, or something entirely your own.
01 / a closer look
Open a dataset, shape a chart with GGSQL, and work through the results with Chartize AI. The data, the query, and the conversation stay together as you explore.
start exploring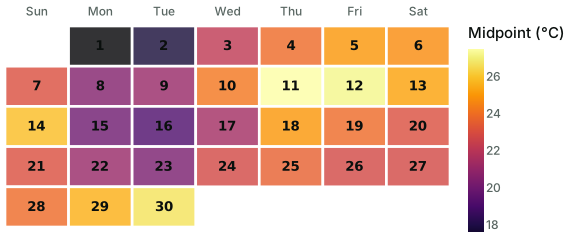
Try an example or import your own file. Browse the rows, choose a view, and change it as your question takes shape: a calendar of temperatures, a map of subway delays, or something entirely your own.
GGSQL brings the Grammar of Graphics to SQL. One query describes both the data to select and the chart to draw. Edit the code yourself, or ask Chartize AI to help build and refine it.
Select a chart mark, a few rows, or a piece of code to give the conversation a starting point. Chartize AI can explain patterns, propose changes, and consult Wikipedia or search the web when a question needs outside context.
Charts, queries, uploads, and conversations are saved locally for each profile. You can explore as a guest; logging in unlocks Chartize AI and opens your account’s local workspaces.
When you ask the AI a question, relevant code and data context are sent to the AI service to help answer it.
Inspired by Posit’s GGSQL and the idea that a question should carry its context.